jonoh81
Jeddah Tower 3,281'
-
Joined
-
Last visited
Everything posted by jonoh81
-
Lol ok. I explained exactly what I meant when I said annexation is not responsible for the growth and you decide to ignore that and make it weirdly personal for some reason. Whatever. It’s a dumb argument and I’m out.
-
The annexation-for-water scheme came about for 2 main reasons. The first was that Columbus was having water supply problems in the 1950s. There were times when parts of the city didn't have water or had very low water pressure. Sensenbrenner grew up in Hilltop, and that was one of the areas that regularly had those water problems. When he became mayor, he had to consider ways of paying for new water infrastructure without worsening already strained supply problems. Any suburbs that wanted to use Columbus water, therefore, had to be annexed into the city so that the city could tap into the tax base. The second reason is more obvious- they knew that the suburbs were becoming popular, and they were worried that the city would eventually be completely surrounded with a shrinking tax base, a problem that has hurt countless older cities ever since. The annexation policy also ensured that the city could still grow outward, taking advantage of suburbanization trends. I generally don't like Sensenbrenner for many reasons. He had little understanding of urban issues and was a heavy promoter of urban renewal and bulldozing neighborhoods for highways, but on this, he was smart.
-
Why even mention that the annexation contributes to growth if you weren't trying to quantify the value of that growth? It's running dangerously close to calling it "fake growth", something I have definitely heard about Columbus in this context. Yes, Columbus has larger boundaries than either Cleveland or Cincinnati, but it would still be growing even if it was still at its 1950 boundaries. The whole debate just seems weird to me and trying to add a value judgement to where that growth is occurring. I would think the much better debate is the type of growth rather than where it happens- sprawl vs dense mixed-use, for example. Dublin's Bridge Park is quality urban development, but it's also in a fringe suburb. I just think the argument is much more complex than location of growth or what was on the land previously. And for the record, my point about annexation was not that no growth was occurring on land that had been annexed decades ago, but that the growth is not occurring specifically due to more land being added that already has a population base, which was true for the period 1950-1980, a lean time for cities nationally. To me, that's a pretty big distinction. I don't know, maybe we're all just talking past one another.
-
Okay, but again, how is that any different than land added to a much younger city in the 19th or early 20th centuries?
-
Exactly. The argument makes no sense.
-
But that's a ridiculous measure of growth. Again, you'd have to define a specific, arbitrary date when land was added to not have that be true. All cities annexed over their histories, so at what year does it stop counting? If Columbus had added 200 square miles in 1910, would the growth be any different now than if the same amount was added after 1950?
-
Accept that's not true, either. The last time I ran the numbers, areas with higher densities and more urban locations within 270 accounted for about 60% of the city's growth. The next largest chunk was around 270 itself, with the smallest % on the far fringes. It's been a few years since I ran the numbers, so it may be time to do it again and see just where it is. The last neighborhood-level data came out in December of 2018 for 2017 data. I can certainly crunch the numbers and repost them here when I'm done. And I don't get your point about the annexed land. Growth doesn't count if it happens on land added after a certain date? Land added in 1960 doesn't count, but land added in 1900 does? How does that make sense? Before what date did the land have to be added to count? I would say this is exactly the stuff I'm talking about where people have arguably arbitrary rules for some places based on questionable information.
-
Same. Most Ohio-based forums actually tend to lack Columbus posters more than anything else. Cincinnati and especially Cleveland have far more people talking about them most places. And most Columbus based articles I've read tend to have just as many negative comments as positive.
-
You weren't being attacked, though. My response to you in that thread was not unreasonable, nor were the questions contained within it. It's fine if you want to only rely on IRS data, but people should also be aware that it shouldn't be taken as gospel because it has large flaws too. When using flawed data that paints a certain picture that isn't necessarily supported by other data, even if that other data also has flaws, there should be some caution in how it's being presented. You weren't being personally attacked, and it has nothing to do with myself or anyone else being afraid of criticism of Columbus. The information presented should just be as up-to-date and as accurate as possible. Most of the time when people are being taken to task for something they've written about Columbus, it's typically because the information they're using is either outdated, incomplete or not thoroughly researched. A common example is that many people have said that Columbus only grows through annexation, yet annexation has slowed to a crawl the last decade at the same time the city is seeing record growth. At some point, it just gets annoying when writers aren't doing their homework. Columbus has plenty of areas it deserves criticism for, not least of which are its transportation issues or having very bad zoning throughout the city that keeps allowing low-density development even in prime urban locations. I've written about some of these issues myself, so when you write me off as just a "booster bro", I think that's unfair. I always try to back up what I'm saying as best I can.
-
Are you talking city or metro? Columbus easily beats Nashville in city growth, even though Nashville includes most of its home county. Columbus beat Austin in city growth in 2017 and was closer in 2018 than most previous years. Charlotte and Columbus grew almost exactly the same last year. All the Sun Belt cites are significantly large in area size than Columbus. In metro growth, they are obviously faster. The difference with Columbus and the Sun Belt cities is that Franklin County attracts by far the largest % of its metro growth, and the city itself the largest % of the metro growth. Most people moving to these Sun Belt cities are moving to the far-flung exurban areas. Nashville, which is again includes most of its home county due to a merger, attracted just 12% of the total metro growth last year. Columbus attracts almost 4x that percentage, double Austin and 50% more than Charlotte. Cincinnati had, in 2017, 80,587 buildings built before 1949, while Columbus had 66,508. Not quite double. I consider Columbus' number even more impressive just considering that they bulldozed so much over the years, and its highway system was far more destructive.
-
I used to have this information on my site until it was hacked all to hell and I lost it, but for the record, here were the states and the totals that the ACS had as net migration contributors to Columbus in the most recent period, 2012-2016. These numbers represent the average estimated net migration per year, not for the whole period. New Jersey: +1,048 Michigan: +989 New York: +767 West Virginia: +767 Virginia: +593 Washington (state): +530 Indiana: +475 Pennsylvania: +394 New Hampshire: +391 Alabama: +336 Alaska: +282 Massachusetts: +281 Puerto Rico: +264 Illinois: +257 Connecticut: +234 Rhode Island: +222 Minnesota: +191 Nevada: +184 Washington DC: +142 Colorado: +141 North Carolina: +135 Maryland: +125 Delaware: +117 Arkansas: +92 Iowa: +92 Maine: +71 Wyoming: +23 Vermont: +17 Oklahoma: +14 If remotely accurate, I think this represents a healthy mix. There are 5 other Midwestern states, 6 Southern, 12 Northeastern and 5 Western. Of all 50 states, PR and DC, the net was +2,139 per year during the 2012-2016 from other states. In 2006-2010, that net total was -1,298 per year. Interestingly enough, Ohio's contribution also almost doubled between those periods, and international migration rose between 30-35%. Only in the last few years has domestic migration exceed international. In any case, the picture here is pretty clear, at least based on the ACS.
-
The IRS data relies heavily on change of address, but mailing address is not necessarily the same thing as residence. Students, for example, often leave their mailing address as their main home address and not, say, a dorm address. Columbus has 100K+ students, with at least some portion of them having a different mailing address than where they live, affecting the accuracy of the data. Furthermore, people who don't file taxes at all don't show up either, meaning that people without jobs or reported income, young people, undocumented immigrants, felons, some retirees, and other demographics don't show up in the data, leaving an estimated undercount of up to 30% a year from just that alone. There are also issues related to timing, as discussed here: https://medium.com/migration-issues/a-simple-reference-guide-to-irs-data-quirks-47b2fb6feb3c The basic point is that there is no dataset that is perfect. They're all flawed in one way or another, which makes relying on only one thing without any stated caveats somewhat disingenuous and prone to the bias of those using any one specific source. Renn likes the IRS data, and that's fine, but he has never once discussed any of its inherent flaws, or attempted to augment it with data from other sources.
-
So Aaron Renn hates me. I've been critical of him at times because he loves to use IRS data to say Columbus only attracts from Ohio and nowhere else, which isn't supported by other data sets, including the Census. He wrote another article mentioning this not too long ago, and I had a lovely exchange: My post: Any reason why you continue to use IRS data, which has some large inherent flaws, such as its inability to accurately capture student populations? Census data doesn’t match these numbers at all. From their data, a city like Columbus is gaining net migration from 28 states and DC and has net overall population gain outside of Ohio, yet the IRS data shows the opposite. The fact of the matter is that cities can’t reach double-digit growth rates per decade only pulling from their own states, especially when the losses in other areas of the state, such as in Ohio, don’t really match up to the growth in other places like Columbus, Cincinnati and the counties that are also seeing growth from the losses of urban Cleveland or Toledo. The math just doesn’t work out without out-of-state migration. You also don’t bother talking about international migration, as if that somehow doesn’t matter to overall growth, when of course it does. Why is domestic migration seen as better than international, anyway? His reponse: You seem to be a perfect example of what I’ve labelled the “Columbus booster bro.” Unsatisfied for others merely to recognize that Columbus is performing well but has some weak points in the same way every other city has weak points, you have to insist on a much rosier picture than actually exists. As it happens, I have a few years worth of ACS data in my system. The surveys I have (up through the 2007-2011 ACS) show the same pattern as the IRS data. Columbus is gaining people from Ohio but on net losing it to the rest of the country. When you say Columbus I assume you mean the Columbus MSA. Even if it is drawing from 28 states that says nothing about the totals. Columbus gained a net of 4 people from Rhode Island in the 2005-2009 ACS survey, but that’s meaningless. Also, the ACS has its own weaknesses. The migration data has a significant margin of error and you are not supposed to do time series analysis with overlapping surveys, which limits the amount of trend analysis you can do. Even if Columbus has turned positive from the rest of the country in recent years, it’s likely extremely marginal since migration patters are very stable. But go ahead. Cheerlead about your city to the 10 people outside of Ohio who are listening using the same ineffective sales pitch that you’ve been using for the last decade. I guess I struck a nerve. He kind of illuminates the problem I have with him, beyond being unable to have people question him, and that's that he hasn't even bothered to look at anything else or he would know that the Census data goes to 2016. Both sources have their flaws, but he's unwilling to step outside of the narrative he has set up. It's unfortunate, as a lot of people read his columns.
-
Originally, there were supposed to be residential towers built on top. I think there was a financing problem for Downtown housing at the time, and there were also issues with state codes that required expensive fire prevention systems to be added to the garage as well, so the whole project fell through. I am not sure if the garage ended up being built to handle upward development, though. There are other garages around the Downtown that were, though, including on Front Street. Sooner or later, I would expect that to happen with at least some of them.
-
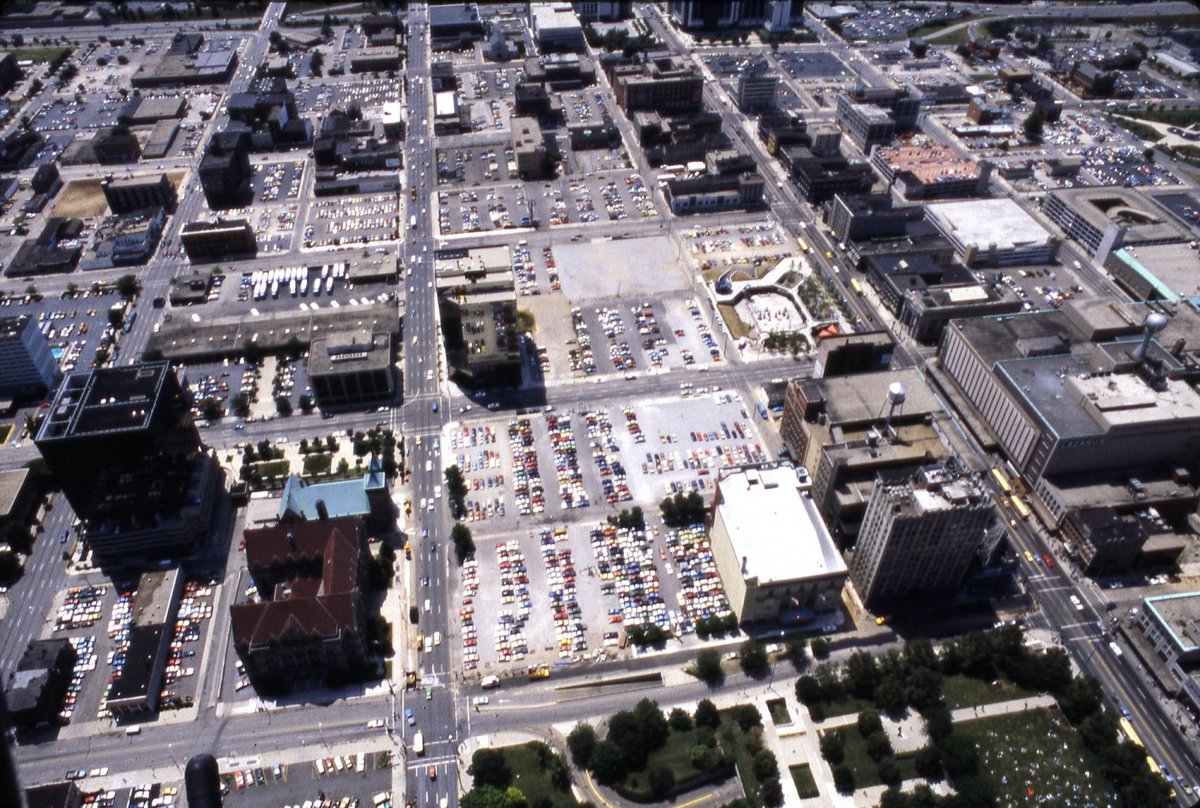
Columbus bulldozed so much of its building density, it's hard to imagine. I saw these photos of the Capital South area of Downtown from the late 1970s-early 1980s and it's just a wasteland. There were very few neighborhoods that were not left pockmarked by frenzied demolition. It's all come so far since then, but the low point was very, very low. What's even more incredible is that the city was building parking garages at this time. As if they needed more parking. There were at least 70,000 or more parking spots Downtown by the early 1980s, roughly a little more than double what there are now.


-
If you're talking about building density, yes, but not by population. There are no areas of Cincinnati that beat Columbus' areas of greatest population density. Most of Columbus is also getting more dense, both by building and population. Cincinnati only has some areas like that, mostly concentrated in areas around Downtown and OTR.
-
They also tore down a bunch of actual historic buildings when they rebuilt the church. The church is cool, but I would prefer the original streetscape.
-
In NE Columbus near the Morse corridor west of Easton, some of the census tracts have 40%-60% of the population being foreign born, and many of them are from African and ME nations.
-
Apartment search listings seem like an odd choice to measure actual migration, especially when they literally only use their own site as the measurement. There are an awful lot of apartment search engines and real estate websites out there. And this doesn't address at all whether people who look for apartments even move.
-
Going back further for Dublin, it's even more drastic. It was #81 of all places in the metro area in 1950, then #61 in 1960, #59 in 1970 and finally #23 in 1980. Most of Columbus major suburbs are on the verge of passing 40,000, a few on the verge of passing 50,000, and many of them are about to or have already entered the top 25 largest Ohio cities. Upper Arlington is not too much smaller than it's peak, and it's been growing since the 2000s, so there's a chance that it could eventually reach and surpass its previous peak. It just needs to find ways to densify the land it has. That might be a challenge, though, because of NIMBYism.
-
I’m not just referring to the above. I think most residential neighborhoods have far more landscaping and trees now.
-
What I always notice about old city pictures is just how awful the cities look. There are few trees, little to no pedestrian infrastructure, manufacturing pollution... it’s no wonder people wanted to leave. We don’t build density like we used to, but we also don’t build completely sterile, dirty places with no thought for residents anymore, either.
-
Here were the top 15 largest cities in Central Ohio since 1840, using the boundary of the current metro designation. 1840 1. Columbus: 6048 2. Lancaster: 3272 3. Newark: 2705 4. Circleville: 2329 5. Somerset: 947 6. Delaware: 898 7. Granville: 727 8. Baltimore: 500 9. Logan: 489 10. Hebron: 473 11. Worthington: 440 12. Marysville: 360 13. Utica: 355 14. London: 297 15. Johnstown: 203 1850 1. Columbus: 17882 2. Newark: 3654 3. Lancaster: 3483 4. Circleville: 3411 5. Delaware: 2074 6. Somerset: 1240 7. Logan: 826 8. Granville: 771 9. Hebron: 649 10. Mount Gilead: 646 11. Marysville: 605 12. London: 513 13. Baltimore: 492 14. Worthington: 484 15. Groveport: 483 1860 1. Columbus: 18554 2. Newark: 4675 3. Circleville: 4383 4. Lancaster: 4308 5. Delaware: 3889 6. Chesterville: 1563 7. Logan: 1489 8. Somerset: 1231 9. London: 1152 10. Marysville: 849 11. Cardington: 846 12. New Lexington: 812 13. Granville: 801 14. Mount Gilead: 789 15. Westerville: 668 1870 1. Columbus: 31274 2. Newark: 6698 3. Delaware: 5641 4. Circleville: 5407 5. Lancaster: 4725 6. London: 2066 7. Logan: 1827 8. Marysville: 1441 9. Somerset: 1153 10. Granville: 1109 11. Mount Gilead: 1087 12. New Lexington: 953 13. Cardington: 918 14. Westerville: 741 15. Canal Winchester: 633 1880 1. Columbus: 51647 2. Newark: 9600 3. Delaware: 6894 4. Lancaster: 6803 5. Circleville: 6046 6. London: 3067 7. New Straitsville: 2782 8. Shawnee: 2770 9. Logan: 2666 10. Marysville: 2061 11. Cardington: 1365 12. Richwood: 1317 13. Mount Gilead: 1216 14. Somerset: 1207 15. Westerville: 1148 1890 1. Columbus: 88150 2. Newark: 14270 3. Delaware: 8224 4. Lancaster: 7555 5. Circleville: 6556 6. London: 3313 7. Shawnee: 3266 8. Logan: 3119 9. Marysville: 2810 10. New Straitsville: 2782 11. Corning: 1551 12. New Lexington: 1470 13. Cardington: 1428 14. Richwood: 1415 15. Granville: 1366 1900 1. Columbus: 125560 2. Newark: 18157 3. Lancaster: 8991 4. Delaware: 7940 5. Circleville: 6991 6. London: 3511 7. Logan: 3480 8. Marysville: 3048 9. Shawnee: 2966 10. New Straitsville: 2302 11. New Lexington: 1701 12. Richwood: 1640 13. Mount Gilead: 1528 14. Westerville: 1462 15. Plain City: 1432 1910 1. Columbus: 181511 2. Newark: 25404 3. Lancaster: 13093 4. Delaware: 9076 5. Circleville: 6744 6. Logan: 4850 7. Marysville: 3576 8. London: 3530 9. Crooksville: 3028 10. New Lexington: 2559 11. Shawnee: 2280 12. New Straitsville: 2242 13. Roseville: 2113 14. Westerville: 1903 15. Utica: 1729 1920 1. Columbus: 237031 2. Newark: 26718 3. Lancaster: 14706 4. Delaware: 8756 5. Circleville: 7049 6. Logan: 5493 7. London: 4080 8. Crooksville: 3311 9. New Lexington: 3157 10. Marysville: 3035 11. Westerville: 2480 12. New Straitsville: 2208 13. Shawnee: 1918 14. Mount Gilead: 1837 15. Utica: 1658 1930 1. Columbu: 290564 2. Newark: 30596 3. Lancaster: 18716 4. Delaware: 8675 5. Bexley: 7396 6. Circleville: 7369 7. Grandview Heights: 6358 8. Logan: 6080 9. London: 4141 10. New Lexington: 3901 11. Marysville: 3639 12. Crooksville: 3251 13. Upper Arlington: 3059 14. Westerville: 2879 15. Mount Gilead: 1871 1940 1. Columbus: 306087 2. Newark: 31487 3. Lancaster: 21940 4. Delaware: 8944 5. Bexley: 8705 6. Circleville: 7989 7. Grandview Heights: 6960 8. Logan: 6177 9. Upper Arlington: 5370 10. London: 4697 11. New Lexington: 4049 12. Marysville: 4037 13. Westerville: 3146 14. Crooksville: 2890 15. Mount Gilead: 2008 1950 1. Columbus: 375901 2. Newark: 34275 3. Lancaster: 24180 4. Bexley: 12378 5. Delaware: 11804 6. Upper Arlington: 9024 7. Circleville: 8723 8. Grandview Heights: 7659 9. Logan: 5972 10. London: 5222 11. Whitehall: 4377 12. Marysville: 4256 13. New Lexington: 4233 14. Westerville: 4112 15. Crooksville: 2960 1960 1. Columbus: 471316 2. Newark: 41790 3. Lancaster: 29916 4. Upper Arlington: 28486 5. Whitehall: 20818 6. Bexley: 14319 7. Delaware: 13282 8. Circleville: 11059 9. Worthington: 9239 10. Grandview Heights: 8270 11. Grove City: 8107 12. Reynoldsburg: 7793 13. Westerville: 7011 14. Logan: 6417 15. London: 6379 1970 1. Columbus: 539677 2. Newark: 41836 3. Upper Arlington: 38727 4. Lancaster: 32911 5. Whitehall: 25283 6. Worthington: 15326 7. Delaware: 15008 8. Bexley: 14888 9. Reynoldsburg: 13921 10. Grove City: 13911 11. Westerville: 12530 12. Gahanna: 12400 13. Circleville: 11687 14. Grandview Heights: 8460 15. Hilliard: 8369 1980 1. Columbus: 564871 2. Newark: 41162 3. Upper Arlington: 35648 4. Lancaster: 34925 5. Westerville: 22960 6. Whitehall: 21295 7. Reynoldsburg: 19519 8. Delaware: 18780 9. Grove City: 16668 10. Gahanna: 16398 11. Worthington: 14956 12. Bexley: 13396 13. Circleville: 11682 14. Hilliard: 7996 15. Grandview Heights: 7420 1990 1. Columbus: 632910 2. Newark: 44389 3. Lancaster: 34507 4. Upper Arlington: 34128 5. Westerville: 30269 6. Gahanna: 27791 7. Reynoldsburg: 25748 8. Whitehall: 20572 9. Delaware: 20030 10. Grove City: 19661 11. Dublin: 16366 12. Worthington: 14869 13. Bexley: 13088 14. Hilliard: 11796 15. Circleville: 11666 2000 1. Columbus: 711470 2. Newark: 46279 3. Lancaster: 35335 4. Westerville: 35318 5. Upper Arlington: 33686 6. Gahanna: 32636 7. Reynoldsburg: 32069 8. Dublin: 31392 9. Grove City: 27075 10. Delaware: 25243 11. Hilliard: 24230 12. Whitehall: 19201 13. Marysville: 15942 14. Worthington: 14125 15. Circleville: 13485 2010 1. Columbus: 787033 2. Newark: 47573 3. Dublin: 41751 4. Lancaster: 38780 5. Westerville: 36120 6. Reynoldsburg: 35893 7. Grove City: 35575 8. Delaware: 34753 9. Upper Arlington: 33771 10. Gahanna: 33248 11. Hilliard: 28234 12. Marysville: 22094 13. Pickerington: 18291 14. Whitehall: 18062 15. Pataskala: 14962 2018 1. Columbus: 892533 2. Newark: 50029 3. Dublin: 48647 4. Grove City: 41625 5. Lancaster: 40414 6. Westerville: 40387 7. Delaware: 39930 8. Reynoldsburg: 38278 9. Hilliard: 36414 10. Gahanna: 35551 11. Upper Arlington: 35522 12. Marysville: 24267 13. Pickerington: 21201 14. Whitehall: 19011 15. Pataskala: 15780 You can really see how the construction of the highway system, particularly 70/71/270 really changed the dynamic after 1950. Before that, the rankings were dominated by urban suburbs and larger places in other counties, but afterwards, cities along 270 skyrocketed upward.
-
I really don't get the point you're making here. There is no correlation between city boundary size and metro size, or NYC would have the largest city boundaries of all instead of Anchorage, Alaska. The indisputable fact is that Texas cities have some of the largest area sizes in the country, regardless of metro size. And for the record, here are the percentages regarding how much area the city includes of the total metro area. Austin: 7.13% Columbus: 7.04% Houston: 6.75% Dallas: 4.0% They're really not that far apart. Here were the city densities in 2018 Columbus: 4000.6 Houston: 3653 Dallas: 3486.4 Austin: 3160.5 And if you think the densities are like this because Texas cities include a lot of suburbia, that may not actually be the case. Here is the census tract density breakdowns for the entire metro areas and the % of total tracts. 30K or More Austin: 0 0% Columbus: 0 0% Dallas: 2 0.15% Houston: 3 0.28% 20K-29,999 Austin: 3 0.86% Columbus: 3 0.71% Dallas: 5 0.38% Houston: 6 0.56% 15k-19,999 Austin: 2 0.57% Columbus: 3 0.71% Dallas: 12 0.91% Houston: 9 0.84% 10K-14,999 Austin: 5 1.43% Columbus: 2 0.48% Dallas: 43 3.3% Houston: 31 2.89% 5K-9,999 Austin: 61 17.48% Columbus: 91 21.7% Dallas: 326 24.8% Houston: 309 28.8% 2500-4,999 Austin: 102 29.2% Columbus: 129 30.7% Dallas: 447 34.0% Houston: 332 31.0% Less than 2500 Austin: 176 50.4% Columbus: 192 45.7% Dallas: 478 36.4% Houston: 379 35.4% Total Above 5000 Austin: 21.4% Columbus: 23.6% Dallas: 29.6% Houston: 33.6% Total less than 5000 Austin: 79.6% Columbus: 76.4% Dallas: 70.4% Houston: 66.4% Seems they're not all that different again, with Austin having the lowest densities across the board. What I meant by peer cities were those with metro sizes within +/- 250,000. Others may use a different definition.
-
I’ve generally used census tracts for urban core growth and I found that about 60% of the growth has occurred in the core city, with 40% on the fringe.