jonoh81
Jeddah Tower 3,281'
-
Joined
-
Last visited
Everything posted by jonoh81
-
Yes, but I've also heard that local banks have consistently been stingy with financing, and developers themselves have also taken a rather doubtful view of the local market, in that neither think that it can support more than they're already doing. It seems that they don't really believe the growth or demand. We have seen a ramp up in the last few years of project sizes, from 4-5 stories consistently to more and more larger projects being proposed. So that might be changing finally, but it's still an issue. That project on the Swan Cleaners site in Downtown that was recently reduced in size by the developer is a good example. There is absolutely no reason for that. The demand is there, so it's either the developer doesn't have the financing or they don't believe in the market. This is why Columbus desperately needs some more out-of-town developers. There aren't many locals willing or able to go big. The housing issue clearly has multiple origins. One thing the city can do is change zoning rules to allow for greater density, if not demand it.
-
Yes, but the city is also growing significantly faster than in the 2000s. The average growth rate this decade is at least 2x what it was in the 2000s, and the last year's is 3x faster. I don't have the link, but there was just a study released that Columbus has a serious housing crisis on its hands because construction is well below population growth. The level of infill is historically high, but even so, it's not nearly enough. That's why reductions in size drive me nuts. Local developers are making the problem worse by underbuilding in prime locations. Worse, NIMBYers like with the recent fiasco in Victorian Village with the Kaufmann project are getting in the way. The city needs to overall its entire zoning plan, IMO, to allow for greater densities across the board. Columbus is not at all prepared for a significant, sustained boom, and it's clearly entering one.
-
Yes, in Columbus many areas that previously had high vacancy rates are filling up quickly. South Linden, for example, saw one of the top 10 influxes of young adults of any neighborhood in the city since 2010. There are few areas in the city that have not seen growth. However, that situation can only last so long. Developers have to like quadruple the construction just to keep up, according to recent studies. Either prices are going to skyrocket over the next several years, or the pace of building will have to. The current market of high growth, low construction is a big problem going forward.
-
I think you have to use the MORPC numbers given the different methodologies and to be consistent. Here they were for 2017-2018 Bexley: +124 Canal Winchester: +157 Columbus: +21,847 Dublin: +1,405 Gahanna: +367 Grandview Heights: +632 Grove City: +905 Groveport: +74 Hilliard: +1,043 Marble Cliff: +5 Minerva Park: +200 New Albany: +193 Obetz: +164 Pickerington: +1,223 Reynoldsburg: +436 Riverlea: +5 Upper Arlington: +392 Valleyview: +6 Westerville: +1,367 Whitehall: +166 Worthington: +155 Delaware: +723 Lancaster: +497 Lithopolis: +53 Marysville: +665 Pataskala: +390 Plain City: +294 Powell: +226 Sunbury: +238 Counties Delaware: +4,076 Fairfield: +2,877 Franklin: +29,818 Hocking: +263 Licking: +1,864 Madison: +1,433 Morrow: +11 Perry: -10 Pickaway: +144 Union: +1,563
-
Year-End 2018 MORPC Columbus-area population estimates and change since 2010. Cities, Towns and Villages in Franklin County Bexley: 13,386 +329 Canal Winchester: 8,828 +1,727 Columbus: 902,674 +115,641 Dublin: 49,905 +8,154 Gahanna: 36,075 +2,827 Grandview Heights: 8,483 +1,947 Grove City: 42,400 +6,825 Groveport: 5,687 +504 Hilliard: 38,106 +9,671 Marble Cliff: 587 +14 Minerva Park: 1,557 +285 New Albany: 10,897 +3,173 Obetz: 5,226 +694 Pickerington: 22,443 +4,152 Reynoldsburg: 37,571 +1,678 Riverlea: 569 +24 Upper Arlington: 35,555 +1,784 Urbancrest: 991 +31 Valleyview: 635 +15 Westerville: 39,955 +3,835 Whitehall: 18,531 +469 Worthington: 14,440 +865 Cities, Towns and Villages in Other Counties Delaware: 39,937 +5,184 Lancaster: 40,888 +2,108 Lithopolis: 1,545 +439 Marysville: 24,224 +2,130 Pataskala: 17,565 +2,603 Plain City: 4,460 +235 Powell: 14,464 +2,964 Sunbury: 5,457 +1,068 Counties Delaware: 208,0687 +33,853 Fairfield: 157,799 +12,875 Franklin: 1,318,164 +154,750 Hocking: 28,586 -794 Licking: 175,755 +9,842 Madison: 44,609 +1,174 Morrow: 34,969 +157 Perry: 36,172 +114 Pickaway: 58,339 +2,641 Union: 58,285 +5,985
-
https://www.bizjournals.com/columbus/news/2018/12/26/columbus-surges-as-ohio-wanes-what-to-know-about.html MORPC is estimating that Columbus grew by 22,000 people through this year, surpassing 900,000 (902,674 to be exact). The 2017 Census estimate was just over 879,000. I haven't followed their previous estimates before, so I'm not sure how accurate they are. 22,000 people in 1 year would be a huge jump from last year's 15K+ increase, though, and pretty much the largest single-year increase in the city's history. It would also likely be a top 5 fastest-growing city again. That alone makes me question its validity. They also estimate Franklin County increased by 30,000 in the last year, also a near record. The little over 70% of the county's growth captured within the city is typical of recent years, so at least that would be consistent. In any case, if the 22,000 is even close to real, that would mean Columbus could hit 1 million residents within 5 years. Edit: I checked MORPC's previous estimates through the 2000s... one thing that they've consistently done is undercount versus the Census. In 2017, they estimated the city at just over 861,000 versus the census being at just over 879,000.
-
They're similar, but not exactly the same. A large amount of Cleveland's losses seem to be happening on the fringes away from the very core, where neighborhoods like Downtown and UC are doing relatively well. Keep in mind also that the 1950 figures are based on extrapolation. When I said before that using 1950 boundaries was difficult, I meant it. I took every 1950 census tract in Cleveland and had to find all the changes they went through to the present day. A lot of them split up over time. The census provides files on how they changed, but even so, the 2017 1950 figures likely represent a slightly different area size than they did in 1950 itself. While they shouldn't be taken as exact, the numbers are as close as we're ever going to get to find modern-day population numbers for the city that existed in 1950.
-
Yes, Cleveland's 1950 boundary is very similar to its 2017 boundary, meaning that pretty much all of the losses in the city have occurred within the 1950 boundary.
-
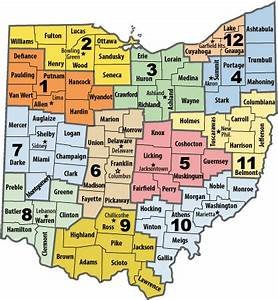
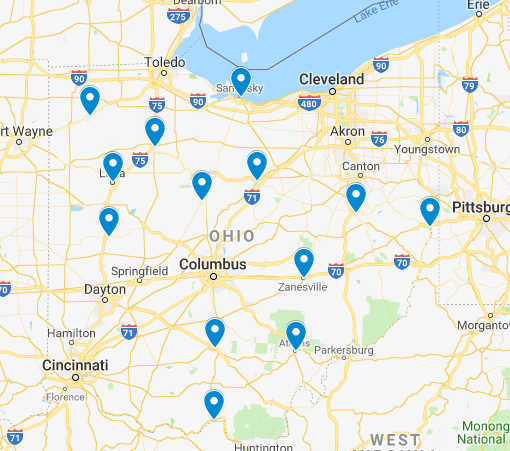
I also don't think we should write them off and that wasn't the intention of my post. I'm saying that if you live in rural Putnam County, you only have so many options. You either move out of the region, you move closer to a bigger city like Toledo, or you stay put and be resentful that your area is dying. So to me it makes sense not to necessarily invest in Putnam County trying to save all those little places, but in neighboring Findlay that, while not exactly large, can become a mini-hub for NW Ohio and provide a 4th option. To give an idea of what I mean, take a look at this ODOT region map. Each mini-region can have 1 or 2 larger places to focus resources. Every county is not going to have one, but they provide localized options for rural residents who don't necessarily want to move, but also need closer access to economic opportunities. The criteria here should be a minimum of 20,000 people preferably and where possible, and be one of the largest existing places in their respective regions. This would include: Steubenville Athens Portsmouth Chillicothe Findlay Lima Bowling Green Sandusky Mansfield Sidney Defiance Marion New Philadelphia I would not focus on any smaller cities that are part of the Dayton, Cincinnati, Akron, Cleveland or Columbus metros, as I think those already provide enough nearby options for rural residents in those areas.
-
Link? Also, I think that's different than saying that they *will* move. Given how rural areas are in decline, more people are clearly leaving than going. The people most likely to survive in rural areas are people who work from home or who are retirees given that there are few jobs out there for anyone. Therefore, it's less about what people may want and more about what they can do economically. Rural areas don't provide like cities do in most cases. There's a similar dichotomy between people who want to live in the city, but also want good schools and affordable housing. A lot of people end up in the suburbs because they can't afford a more urban location. Economics matter more than desire. Furthermore, I think that when people say "rural", they don't really mean 50 miles from the nearest town or city. They mean low-density suburbia. Even those who don't really like cities also don't necessarily want to be very far from the conveniences they provide.
-
The top tracts are near OSU, but there is high density throughout the core areas.
-
I don't think that's a function of the urban/rural divide. I think that's a function of having divisive leaders for a good 30-40 years that have made political careers off of making them worse. Rural voters may be resentful of being left behind, but that resentment is not exactly all organic. Also, you could argue that there was less polarization when there was more dispersal, but society overall was much more regressed socially in a lot of ways than it is now. I'm not sure I want to go back to that. In fact, I know I wouldn't want to. In any case, the point is that people shouldn't be left behind, but we have to do it in an intelligent way. Trying to rebuild every village or town is a waste or resources. It has to be more strategic than that.
-
Why do we need to save it? Honest question. Rural America has a disproportionate chunk of the political power over where most people live, their lifestyles often depend on heavy subsidies (like farming), and infrastructure costs far more to build and maintain because there are fewer people to pay for it. There aren't jobs and there isn't much economic incentive to create them there. If anything, rural America is a net drain on the economy and the actions and money that it would take to reverse the decline would be high, if such a reversal could even happen. I would much rather see those resources go to select places that would better utilize them. For example, in Ohio, I would focus on all the big cities, but also places like Findlay, Athens, Wilmington, Marietta, etc. that already have decent bones and could become more focused for economic growth for their respective mini-regions. I don't think it's wise trying to save every little town.
-
Density Profiles 2010 and 2017 By Census Tract 30K+ Cleveland: 0 : 0 Cincinnati: 0 : 0 Columbus: 0 : 1 25K+ Cleveland: 0 : 0 Cincinnati: 0 : 0 Columbus: 1 : 2 20K+ Cleveland: 0 : 0 Cincinnati: 0 : 0 Columbus: 3 : 3 17.5K+ Cleveland: 0 : 1 Cincinnati: 0 : 0 Columbus: 5 : 4 15K+ Cleveland: 1 : 1 Cincinnati: 3 : 1 Columbus: 6 : 6 12.5K+ Cleveland: 7 : 7 Cincinnati: 6: 3 Columbus: 7 : 8 10K+ Cleveland: 25 : 23 Cincinnati: 9 : 7 Columbus: 8 : 13 7.5K+ Cleveland: 69 : 59 Cincinnati: 15 : 22 Columbus: 33 : 41 5K+ Cleveland: 116 : 110 Cincinnati: 50 : 51 Columbus: 83 : 91 These figures are for all tracts that are wholly within the city limits. This means that some tracts that have only small pieces of a city have been excluded.
-
Okay, so based on the 1950 boundary, here were the results. Cleveland 1950 Boundary 2010-2017 Change: -6,000 Cleveland Metro Change 2010-2017: -18,396 1950 Boundary % of Metro Population Change 2010-2017: 32.6% 2017 Cleveland City Boundary 2010-2017 Change: -11,290 2017 City Boundary % of Metro Population Change 2010-2017: 61.4% Cuyahoga County 2010-2017 Change: -31,608 Cuyahoga County % of Metro Population Change 2010-2017: 171.8% Cincinnati 1950 Boundary 2010-2017 Change: +2,392 Cincinnati Metro Change 2010-2017: +64,502 1950 Boundary % of Metro Population Change 2010-2017: 3.7% 2017 Cincinnati City Boundary 2010-2017 Change: +4,356 2017 City Boundary % of Metro Population Change: 6.8% Hamilton County 2010-2017 Change: +11,448 Hamilton County % of Metro Population Change 2010-2017: 17.7% Columbus 1950 Boundary 2010-2017 Change: +6,566 Columbus Metro Change 2010-2017: +176,751 1950 Boundary % of Metro Population Change 2010-2017: 3.7% 2017 Columbus City Boundary 2010-2017 Change: +92,137 2017 City Boundary % of Metro Population Change: 52.1% Franklin County 2010-2017 Change: +128,567 Franklin County % of Metro Population Change 2010-2017: 72.3% For Cleveland and Cincinnati, the 1950 and 2017 boundaries are very similar, as both cities were unable to grow much area-wise after that time. Columbus is obviously much different. So to your point about what is urban and not, let's assume that "urban" means either a population density at or above 5000 ppsm and/or within an obviously urbanized location (such as Downtown, which is urban, but with a population density below 5000). Let me pull those figures and post them.
-
It's not flawed, though. It measured what I wanted it to measure- if population was going into a city's limits or not and what % of that total metro growth did so. Cities arguably contain most of a region's urbanity, so I don't think it's that controversial as far as that goes. The numbers are accurate in terms of what I wanted to show for them. That city limits differ cannot be helped in that case. 1950 limits are also different for each city in terms of their built area and area sizes, so that wouldn't exactly change the problem as much as you think it does. What you're asking for is different than what I measured, IMO. It seems you want something a lot more detailed, down to the neighborhood level. As I said, 1950 boundaries are difficult to measure. To find them for the 3-Cs, I had to find 1950 boundary maps for each, get the census tracts that made them up, and then go through them decade by decade to see how they changed over time. Census tracts have split multiple times since 1950, and current ones don't always exactly match how they were in 1950, so you need to find the equivalent or as close to it to get the population changes. It would be MUCH easier to simply ignore boundaries altogether and use a standard "urban" definition- something based on density, perhaps?- to find out how those areas are growing versus areas that do not match the definition. Even then, it would take a significant amount of time. I do this stuff for free, on my own time. If I had all the time in the world and didn't have more than one other job, sure, I could wade through that data minefield. However, because I have already done all this for the 3-C 1950 boundaries, I can at least provide that data. I'll post it soon.
-
One other thing about the household size of the mentioned Columbus zips... most of them have not seen a drop, or have been increasing recently. 43201 2000: 2.16 2010: 2.24 2017: 2.46 43205 2000: 2.38 2010: 2.18 2017: 2.33 43206 2000: 2.32 2010: 2.19 2017: 2.22 43215 2000: 1.47 2010: 1.46 2017: 1.52 43223 2000: 2.58 2010: 2.64 2017: 2.72 43229 2000: 2.23 2010: 2.33 2017: 2.48 This only further boosts my view that the estimates are problematic. The 2000 and 2010 numbers are actual counts, the 2017 is an estimate. However, even if we discounted 2017, 3 zips saw household size increase 2000-2010, 1 essentially didn't change and 2 dropped. If anything, this suggests that more areas of urban Columbus are actually growing in household size or are fairly steady.
-
So I went back and looked at a few of the above Columbus zip codes more closely, and there are Zip Code 43215 This area is made up of all or parts of Tracts 21, 22, 30, 32, 40, 42, 52 and 57. The western offshoot I didn't include as it is essentially just the river with no or very little population either way. This would include all of Downtown, the Short North up to 1st Avenue, the southern 1/2 of Italian Village, most of the Brewery District, a very small portion of German Village and East Franklinton. Only 42 and 57 were estimated to have lost population. Only 42 I believe, as 57 is German Village, which hasn't changed much in terms of household size in decades, and the Brewery District, which never had much housing to begin with, so there's not significant changes there in household size. Only 42- East Franklinton- is likely anywhere close to accurate just given that it is beginning to gentrify and the city tore down the public housing near Dodge Park. Overall, these tracts combined for a 2010-2017 gain of 1,842, a little more than the overall zip code estimate, but likely way below the actual population growth. Household size just hasn't changed enough in them to justify the low numbers, as well as all the additional housing with no increases in vacancy rates. Zip Code 43201 This one I had the most obvious reaction to. This zip includes most of Tracts 14 and 15, 10, 12, 13, 16, 17, 1810, 1820, 20 and most of 1110. Based on estimates and previous trends, 10, 12, 14, 15, 17 and 1110 all likely lost population. However, 16, 20, 1810, 1820 likely gained. Overall, it's certainly possible there had been a loss through 2017 if we are talking about sophomores moving from on-campus to on, the gentrification of Weinland Park and the losses occurring in Milo-Grogan. However, the estimated loss in the area is far less than the 3600 shown for the zip code, at just over 2000, almost all of which is coming from just 2 tracts, 1110 and 12. Meanwhile, Tract 1121, the main OSU Campus, gained more than 2000, suggesting that this is where those people went- literally to the other side of Lane and High and just outside of the zip code. It may take a few years to refill these neighborhoods, but I suspect this will happen far faster than anyone thinks given that much of this housing is historic and generally cheaper than the city average. Older students, faculty and young adults looking for an urban location would find this area very attractive. Meanwhile, the Census also has large parts of Linden practically booming. So again, I think zip code and tract estimates have to be held in doubt to a degree. Common sense and a deeper look at the trends and data is necessary.
-
I generally like Homeport, but this design is too hospital-like, and the proposal to tear down the church should be rejected. It would make a great remodel into housing.
-
You should take these with a big grain of salt. No one in their right mind should believe the Short North has lost population, let alone thousands. The Census has unfortunately routinely mishandled the urban areas of Columbus for whatever reason. I say this because the 2010 showed strong growth. That didn’t reverse when you add dozens of large infill projects with very low vacancy rate. That’s not bias, that’s a rational conclusion.
-
What you’re asking for is virtually impossible. First you would need an accepted definition of “urban”. Then you would need to somehow measure only those urban areas within city limits and then find population figures only for those. I actually did the 3C 1950 boundaries, but it took ages just to put those together. It would take many years to do it for all the largest US cities. Even then, 1950 boundaries don’t necessarily include all urban areas in a city, anyway. I get that all cities and their boundaries are different, but there’s only so much you can reasonably do to standardize them. I fully stand by my work. BTW, Columbus ‘ 1950 boundary is also seeing lots of population growth, so that is consistent.
-
Yes, I think those are better indicators, but at the same time, are these things happening across the city or only in certain neighborhoods? I'm much more versed in Columbus demographics and population, but I've done enough comparisons over the years to believe that the rate of loss has slowed drastically this decade in Cleveland. I'm just not yet convinced there's more to it than that yet. You can have very successful, booming neighborhoods like UC and Downtown, yet still lose population from other parts of the city that more than make up for the gains. The rising parts of Cleveland are still a relatively small part of the city. I think we're still a good decade or more from any potential growth years, TBH.
-
What's interesting, at least to me, is that I'm seeing more and more of my own work in these stories. Back when the 2014 MORPC report came out, I was one saying that the numbers were far too low given that metro growth had been accelerating for the previous 3 decades. I'm also the person who calculated that % of metro growth that Franklin County receives, as well as how much Columbus gets. I did the same calculation for all of the largest US cities here: http://allcolumbusdata.com/?p=9393 I'm glad years of crunching numbers is getting some attention, but sometimes a shoutout would be nice!
-
I'd be curious as to what other indicators are making you think that, then.
-
To be fair, also, Cleveland lost more jobs than either of the other 2 Cs during the recession, and is only now barely above its pre-recession peak literally this year. Cincy and Columbus have blown past their previous peaks years ago. In that context, it kind of makes sense, as Cleveland has still been in recession recovery until now.