ProspectAve
Banned
-
Joined
-
Last visited
Everything posted by ProspectAve
-
I agree---it warrants a deeper study. Its not only people moving to warm states as Idaho and Montana are high up on the list---but that may just be people being sick of the high prices in California so they move out to the big open lands in those nearby states. Indiana is pretty conservative as well--but not as bad as Ohio--and they gained population---but that may be from people leaving Chicago. It'd be particularly interesting to see what parts of Indiana gained people--and from where. Oklahoma still baffles me--whose moving there and why? 780,000 people left the top three states--CA, NY, and IL--those people have gone somewhere. The top three winning states--TX, FL, and NC--account for only 650,000 while, of course, taking people from Ohio, Illinois, and other places. We need to focus on both--the net migration and immigration. Immigration alone won't solve the problem as even with the giant gain in immigration, Ohio still lost people, and we had a higher-than normal year. For natural Increase (Births minus Deaths), we were 3rd last in the whole country. THAT is something we should look at as well. Our natural increase in 2021-22 was -19,543! For natural increase:
-
The 1% figure I cited is for "Greater Cleveland"--so the seven counties (Cuyahoga and the six outer ones). Yes! Be a sponsor. Here's the link: https://welcome.us/connect
-
Its a public square -- people should be able to mill about wherever they feel like. Jaywalking here or anywhere in the city, actually, should not be an issue. We have far bigger problems and we should not have any concern for jaywalking, especially any police actions around it.
-
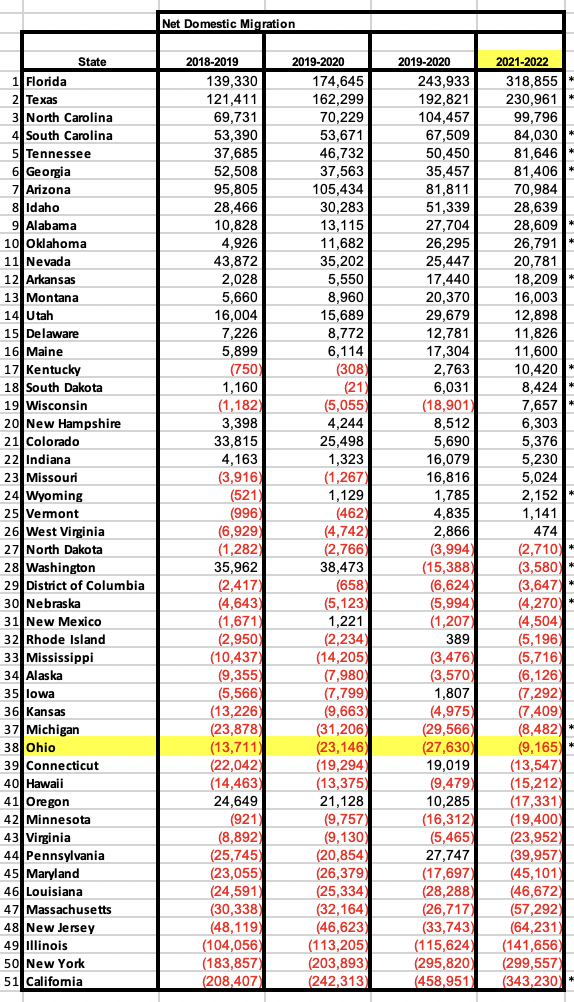
Alabama and all its southern policies and behaviors is way ahead of Ohio and its a much smaller base to begin with compared to Ohio. Oklahoma is also beating us. Same comment. Alabama and Oklahoma are #9 and 10! Ohio is #38. " Other states considered economically robust with large preeminent cities MA, MD, NY, PA, IL, etc" are only a handful of states. 37 states are ahead of us, not just MA, MD, NY, "etc." Here's the full list for transparency and discussion:
-
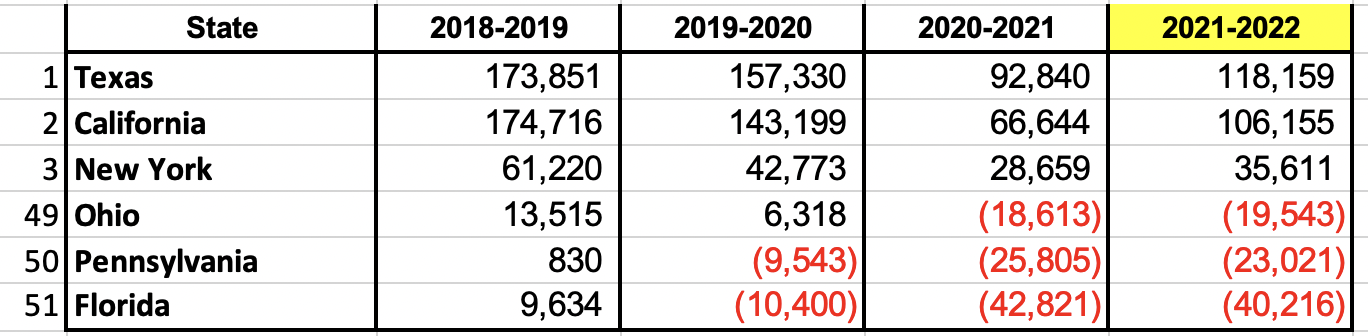
Based on the latest Census estimates: "In the newly released census data for 2021-22, both natural increase and immigration rose, but due to increases in legal immigration, that component added over 1 million people to the national population, compared to 245,000 for natural increase. Thus, the bulk of last year’s increase in population growth (about 86%) was due to a rise in immigration." (from Brookings) I don't know if city-level info is released but there are numbers at the state level. Net International Migration - OHIO 2019-2020: 13303 2020-2021: 9281 2021-2022: 24112. (#13/51 in the US for biggest net gain--#1 is CA) Natural Increase (Births minus Deaths) - OHIO 2019-2020: 6,318 2020-2021: -18,613 2021-2022: -19,543 (#49/51 in the US---#1 is TX) Net Domestic Migration - OHIO 2019-2020: -23146 2020-2021: -27630 2021-2022: -9165 (#38/51 in the US---#1 is FL) So even with a giant boost in net intl migration (+24k), Ohio STILL lost over 4,000 people. Ohio's policies are killing it.
-
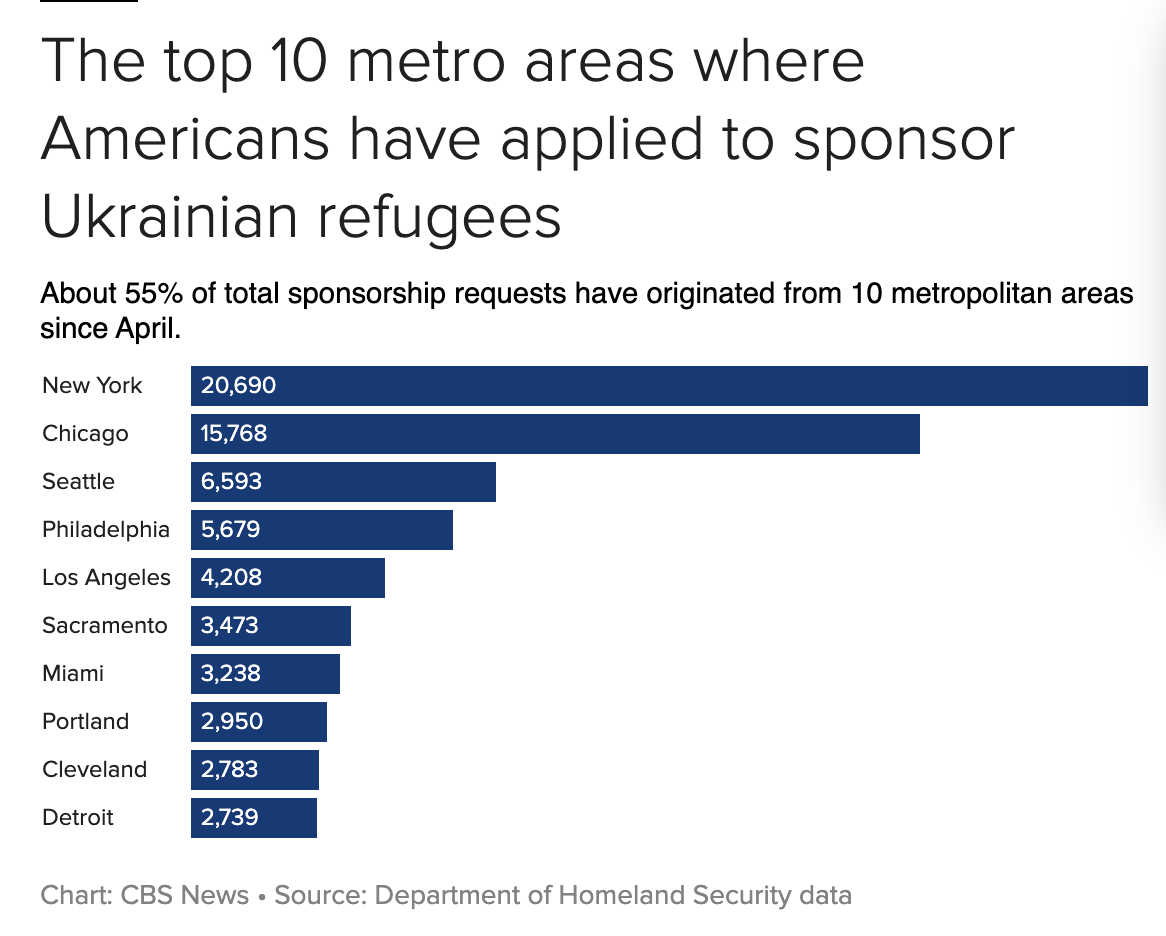
Well, at least we're on the top 10 list for sponsorship by regular people: Source: https://www.cbsnews.com/news/ukrainian-refugees-sponsors-5-states-applications/
-
I agree with @ExPatClevGuy - it does look unfinished. Maybe if they have lighting on that top part it will help, though lighting won't help during the time it matters most--during the day.
-
Only 3,000? While we need the people, its disappointingly low. If the US got 221,000 since the start of the war and with Cleveland's already strong Ukrainian presence, we should have received a good number of people far greater than 3,000. Instead, 3,000 is only around 1.3% of 221,000 which is about what Cleveland is to the US. So we got an exactly equal share instead of any benefit of already having a larger than average Ukrainian population.
-
Is the Downtown microgrid that was mentioned years ago? The article makes no mention of where the microgrid would be. Also how will it be powered other than the Lake Erie wind turbrines cited in the article, that may never happen?
-
I'd say the largest growth has been with Indians. This is purely just personal observation. In the past decade or so, I've noticed a bigger increase in Indians around than I have in a change in Chinese, Japanese, Vietnamese, Korean, Malaysian, etc.
-
There should be some qualification in the process that the historic tax credits represent a final or near-final piece of funding; otherwise, actual funding may never be used by these projects and instead other projects that may have actually used the funding could get built but instead were passed over by projects that will never get built. Maybe Ohio knows this and therefore wins the PR side of giving money to Cleveland but not really having to do so if they know the rest of the capital stack won't ever happen.
-
Is Columbus losing population? At least amongst people with Linkedin accounts? According to the latest (Dec 2022) workforce report from LinkedIn: "Migration. The U.S. cities losing the most people are College Station-Bryan, TX; State College-DuBois, PA; and Tallahassee, FL. For every 10,000 LinkedIn members in College Station-Bryan, TX, 235 left in the past 12 months...." 5th on the list is Columbus, losing 56 people per every 10,000 LinkedIn members. Columbus is still gaining people from Cleveland more than Columbus to Cleveland migration. When you do a deeper dive into Cleveland (they do a report on the 20 largest US metros--so you can see Cleveland, but not Columbus or Cincinnati), it shows: Columbus, NYC, and LA gained the most workers from CLE in the past 12 months. Columbus ranked #1 at Cleveland losing 2.76 Linkedin members for every 10,000 to Columbus in the last year. NYC was 2.4 and LA was 2.1. Regarding gains for Cleveland, ranked #1 was Toledo at 1.26 Linkedin members per 10,000, then Cincinnati at .74 per 10,000. https://economicgraph.linkedin.com/resources/linkedin-workforce-report-december-2022
-
I agree that it is more clunky looking now than before, even if it was a smart retrofitting or solution to solving the problem.